Advanced Clustering Technologies > ClusterVisor > Key Features > Statistics, Monitoring & Alerting
Statistics, Monitoring, and Alerting
ClusterVisor makes it easy to keep track of cluster health which is important to its proper operation.
Getting stats from nodes
Stats are a core feature of ClusterVisor, and are used to refer to any piece of changing data on the devices in the cluster. One component of cv-clientd (ClusterVisor’s client daemon that runs on each node) is to gather statistics from the node and send them to your ClusterVisor appliance or server. The stats are driven by a plugin architecture with stats from the following domains collected:
- CPU – CPU usage, load, frequency
- Disks – Disk Usage, read/write I/O rates
- Firmware – BIOS / IPMI firmware versions
- InfiniBand – InfiniBand and OmniPath performance and error counters, and I/O throughput
- IPMI temperature – All the temperature sensors throughout the node
- IPMI fans – RPMs of each fan in the system
- IPMI voltages – Voltage readings from the power supply
- MD (Software RAID) – status of any software RAID arrays on the system
- MegaRAID – status of any hardware based broadcom/LSI RAID arrays on the system
- Memory – Memory and swap usage
- Network – Statistics on each Ethernet interface
- NFS – Status of any NFS mounts
- NTP – Provide details about the time and if it’s currently synchronized with your time server
- NVIDIA – detailed usage, power, memory statics by GPU on your system
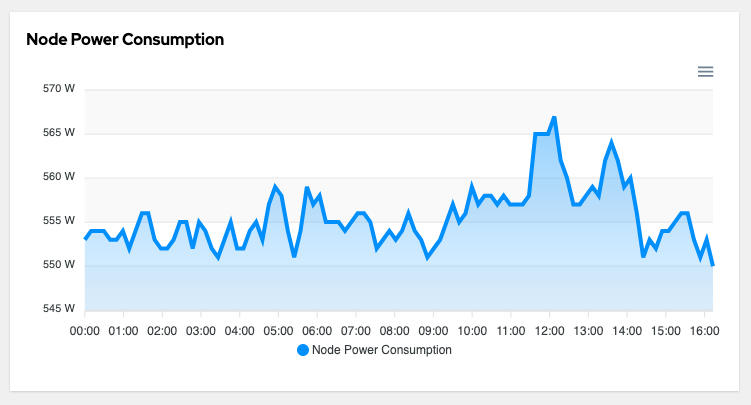
- Power – node level power consumption
- System – kernel versions, process counts, uptime
- ZFS – Status of any ZFS zpools on the system
Most nodes in your cluster will have more than 300 unique stats collected from them.
Gathering stats from devices
For devices that aren’t able to run the cv-clientd daemon, statistics can be gathered via SNMP. This is most commonly used to gather information from network infrastructure devices. ClusterVisor currently supports the following devices:
- Power distribution units (PDUs): APC, Geist/Vertiv, ServerTech
- Uninterruptible power supplies (UPSs): APC
- Air Conditioners: APC in-row
- Switches: Netgear
The list is always growing, and support for new devices can be easily added. Contact us for details.
Custom stats
ClusterVisor already collects the most common stats, but if a particular stat you are interested in is not available, you can add it! There are simple command line tools available to inject custom stats, or you can create your own stat plugin as well.
Stat history and retention
ClusterVisor collects stats every 30 seconds. With a large number of nodes, the disk space requirements would grow quite large and unmanageable. To prevent this from becoming an issue, we use a time series storage approach. The default retention periods are:
- 30 second interval – keep for 2 weeks
- 5 minute interval – keep for 2 months
- 15 minute interval – keep for 3 months
- 1 hour interval – keep for 5 years
Viewing your stats
Stats can be viewed via the ClusterVisor web interface. Stats can be used on any number of customizable dashboards, or queried ad hoc. Stats can be also used as a heatmap on rack diagrams to help pinpoint temperature hotspots or other possible environmental problems in the datacenter.
The stats can also be correlated with SLURM jobs to be able to see what’s happening on a node during a job run. Helping administrators answer questions like, why did my job run slow?
Monitoring rules, alerts, and actions
Any stat can be used as part of a monitoring rule. The ClusterVisor monitoring rules engine allows administrators to create rules for when anything on their cluster is not behaving how it should. Some ideas of the rules that could be created:
- Temperature of the node is above a threshold
- When a group of nodes firmware are not all the same version
- An InfiniBand interface is down or running at the wrong speed
- A RAID array has lost a drive
- A ZFS zpool is degraded
- And many more
Monitoring Rules can fire any number of actions on failure. Actions can be a simple email to an administrator, or any script. With the script engine, you can easily shut down nodes, drain them in SLURM, clean up files, etc.
A full history of any rule failures, with timelines of failure, is available. When a rule fails, a point in time snapshot of all the stats are also saved. This allows you to easily go back in time and see what was happening on a node when the failure occurred.