 ClusterVisor has lots of information about nodes and devices in your cluster. In order to make sense of this data, dashboards are available.
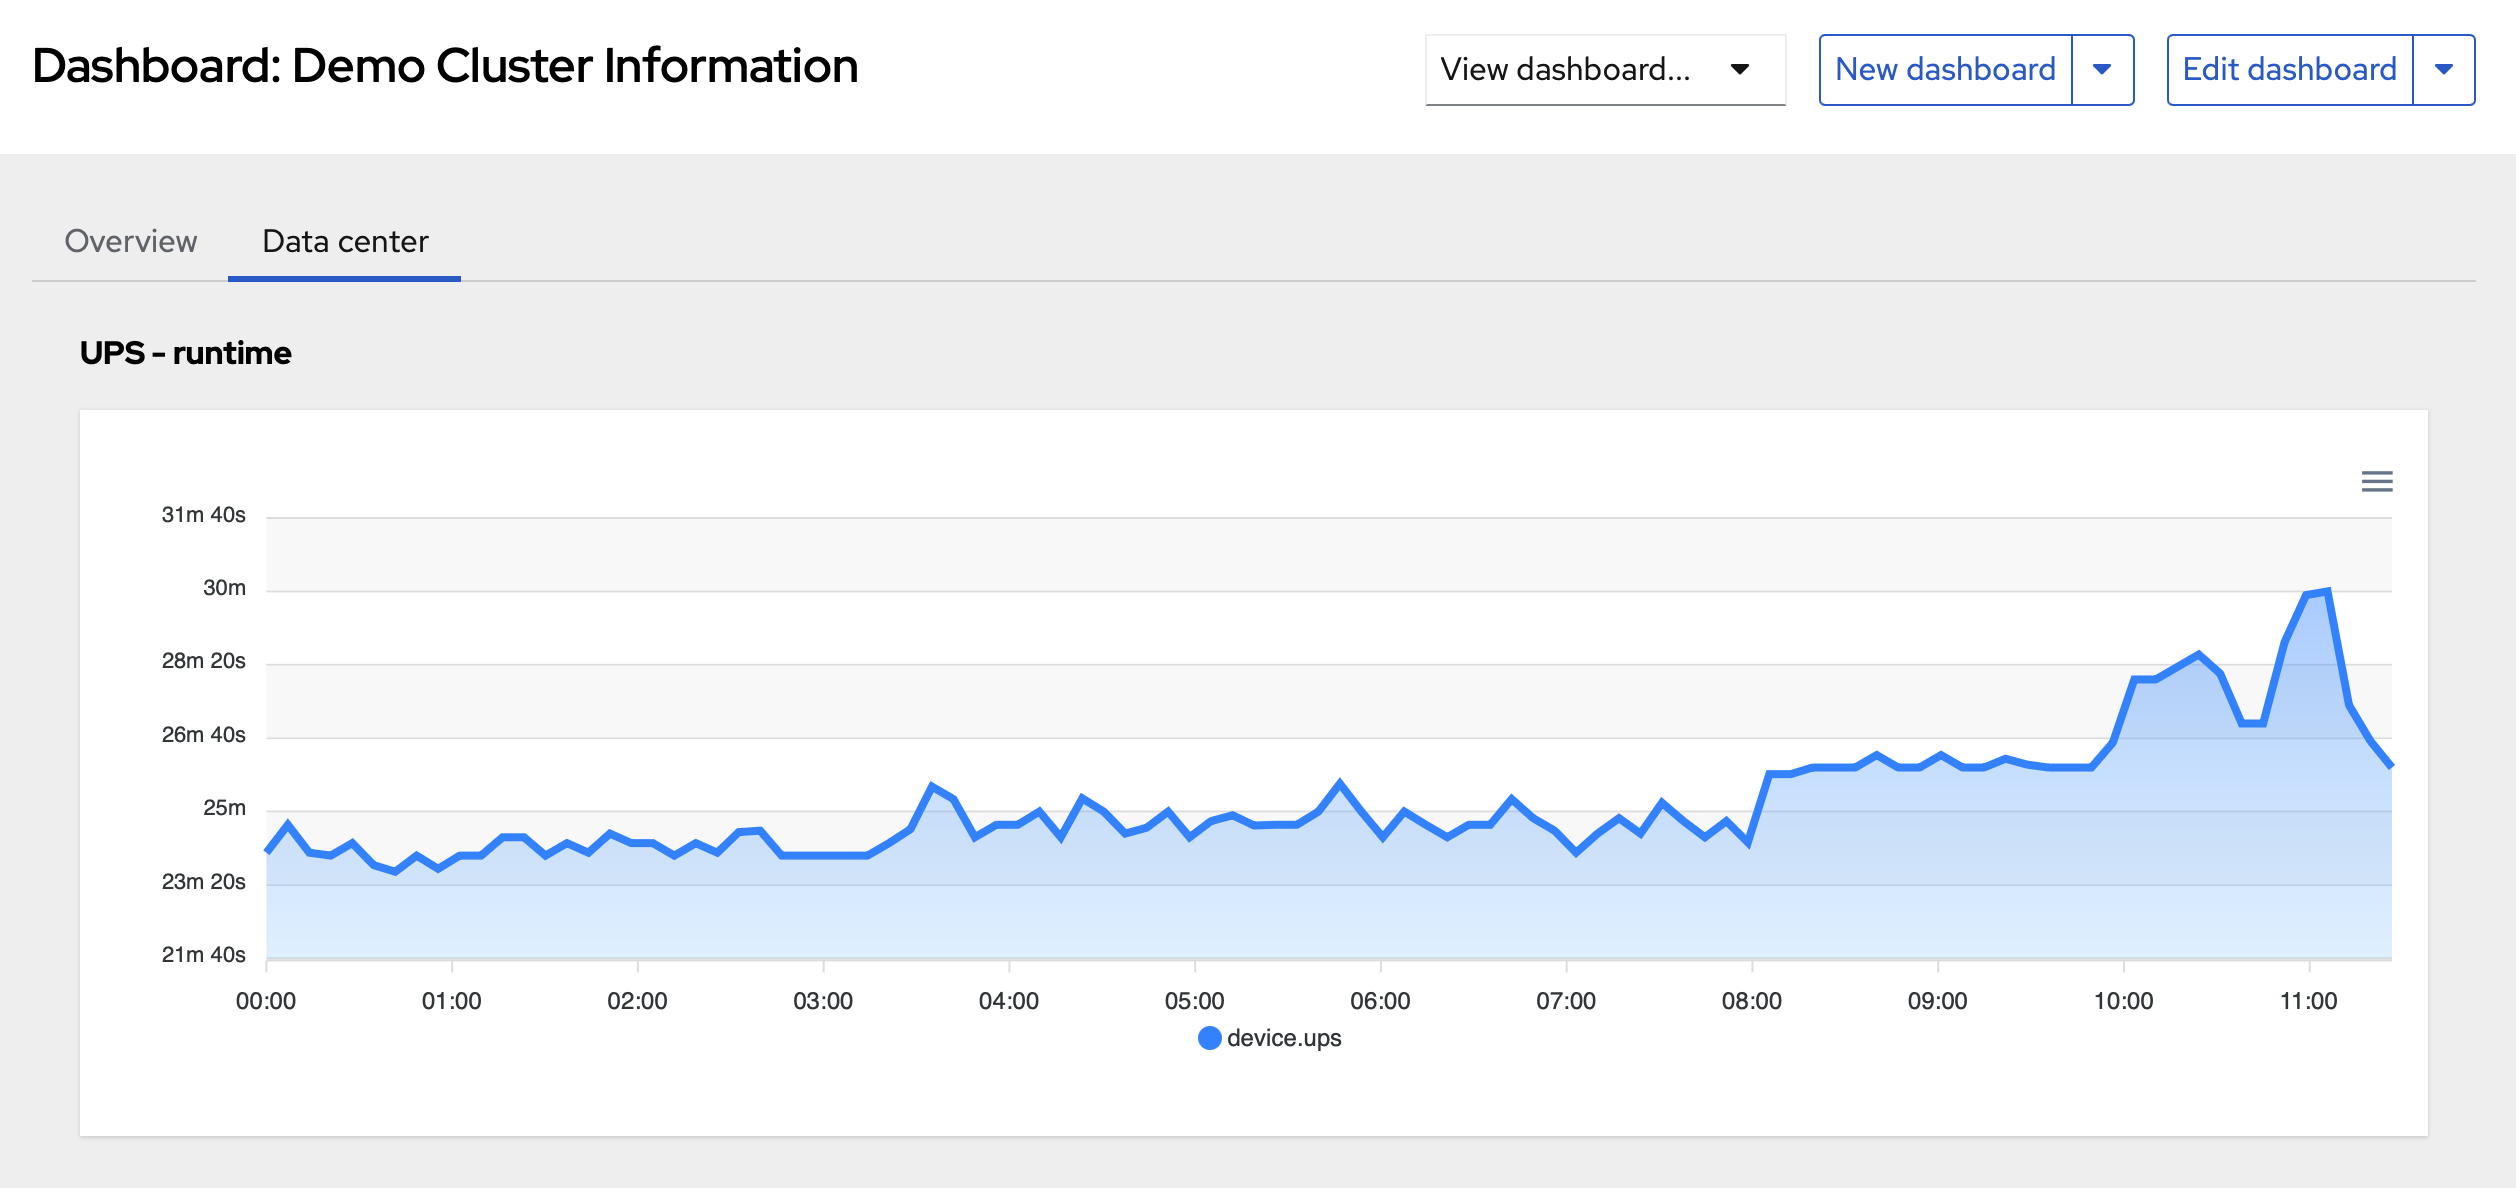
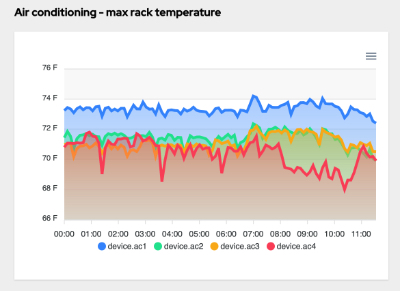
Easily spot which nodes are running hotter than others, or are more utilized, etc. You can also incorporate data from other devices such as PDUs, UPS, air conditioners, etc.
An administrator can customize their dashboards using any number of widgets to help visualize the data in the best possible ways. Some widgets available are:
- Tables of data
- Graphs
- Gauges
- Rack diagrams
- Scheduler details
Dashboard customization is completely point and click through the web UI, no coding required.
Role based access control
Each dashboard can be also integrated with our role based access control system to pick and choose which users can view which dashboards. For example, users may only see some details about the nodes and scheduler, while administrators could view information about the data center environmentals, etc.