Rack Diagramming
ClusterVisor makes web-based rack diagramming an easy to use drag and drop experience. All nodes and devices entered via the configuration management can be added to a rack diagram.
Once diagrammed, the resulting image allows you to visualize your cluster as it is in the datacenter. With the customizable dashboards, you can apply any statistic gathered to the diagram making it a very visual way to see what is happening on your system.
Here we are seeing heat maps of system temperatures within a rack diagram: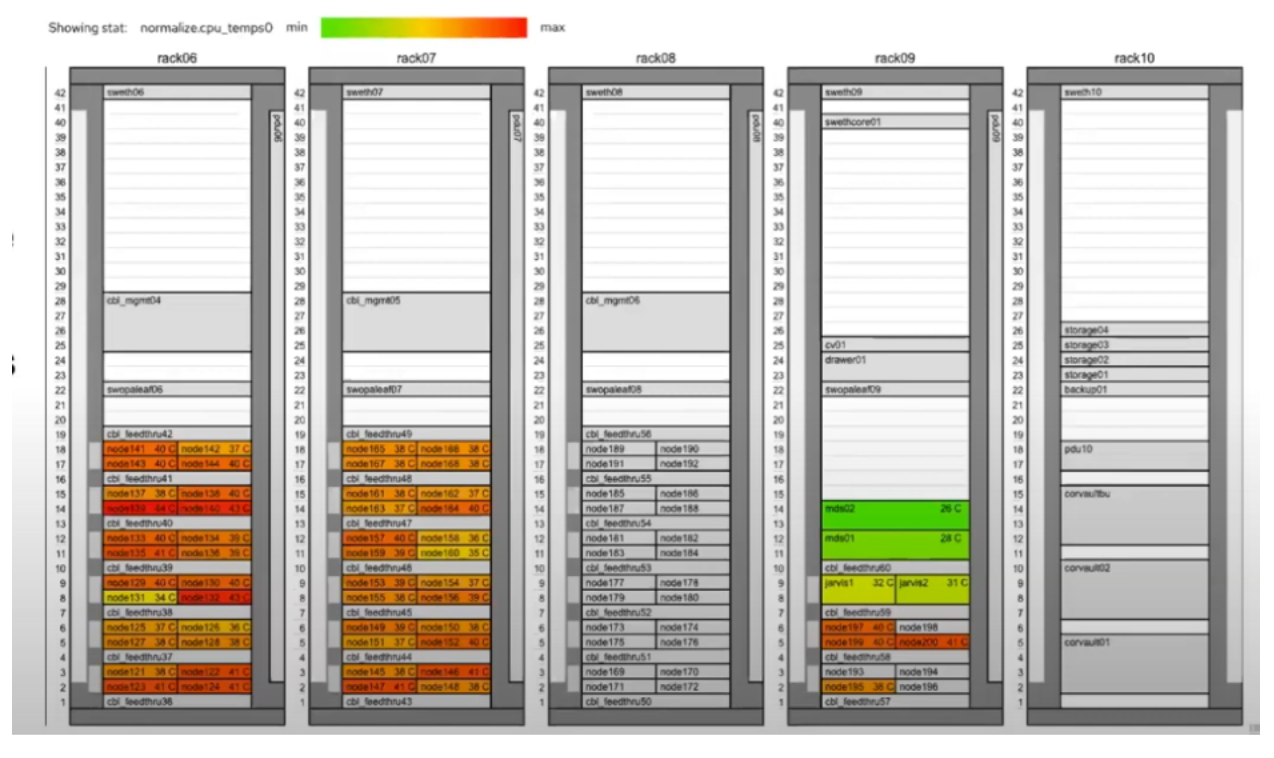
Racks can also be used as a selector to perform actions on specific nodes. For example you can do things like power down all nodes in rack1, or run other commands a rack at a time.